

Proximity to the grid is a make-or-break factor for data centers, driving key factors such as capital costs and time to market. So this tight clustering is no surprise—but how does it compare to other site criteria?
The Othersphere platform has the answer—bringing together dozens of spatial and time series data layers, to pre-model billions of projects, at millions of locations worldwide.
For those working on developing, funding, or utilizing data centers, this search engine for sustainable infrastructure saves time, reduces risk, and enables better decisions.
We’ll shortly be launching data center coverage within the Othersphere Explorer tool, and in advance will share dozens of similar posts that highlight the many criteria that enable high performance compute infrastructure.
Prior to launch we’ll release an ebook containing this insight series, offering a unique, data-driven guide to the ideal characteristics of world-class data centers.
Our data center module is currently in closed beta, but if you would like to be notified when this ebook is released—or request a demo today—we’d love to hear from you.
Source:
Original data source:
Spatial coverage:
Visibility:
Methodology:
Download:
License:
The data provided herein is made available on an "as-is" basis, without warranty of any kind, either expressed or implied. The provider does not guarantee the accuracy, completeness, or usefulness of the information. By downloading this data, the user acknowledges that the provider shall not be held liable for any errors, inaccuracies, or omissions in the data, nor for any damages, losses, or consequences arising from the use, misuse, or reliance on this data. The user assumes full responsibility for the use of the information provided and agrees to use it with caution and at their own risk.
Data center locations today show a moderate skew toward grid regions with lower carbon intensity—but how much does this really influence site selection?
At CERAWeek 2025, data centers were very heavily discussed, including topics such as geopolitics, data sovereignty, monetization opportunities for previously-stranded energy supplies, and the overall uncertainty data centers have introduced into energy demand forecasting.
Climate change factored into conversations on the role of natural gas, nuclear, and geothermal, but global warming was generally just one of the many complexities described by the developers, funders, and policymakers working on the future of compute.

Data center locations today show a moderate skew toward grid regions with lower carbon intensity—but how much does this really influence site selection?

Speed to market, economics, data sovereignty, and end-user latency are some of the most critical factors for developers, operators, and financiers of compute / AI infrastructure.
Focus on carbon intensity of compute will continue to grow however, particularly as policymakers and the public become ever more aware of the rising energy demand and climate impact of data centers.
But as the annual solar PV capacity factor data above shows, today’s data centers show little sun-seeking behavior. Hourly capacity factor data shows a similar pattern.
This makes sense given the challenges created by solar intermittency and limited incentive to experiment with new operating strategies to date.
But in the right locations, this will likely shift going forward due to:
⬡ Falling delivered costs of solar power
⬡ Increasing market and behind-the-meter supply options
⬡ Corporate GHG goals and public attention shaping demand
⬡ Proving out reliable data center operating strategies that take advantage of intermittent power and/or load shifting.
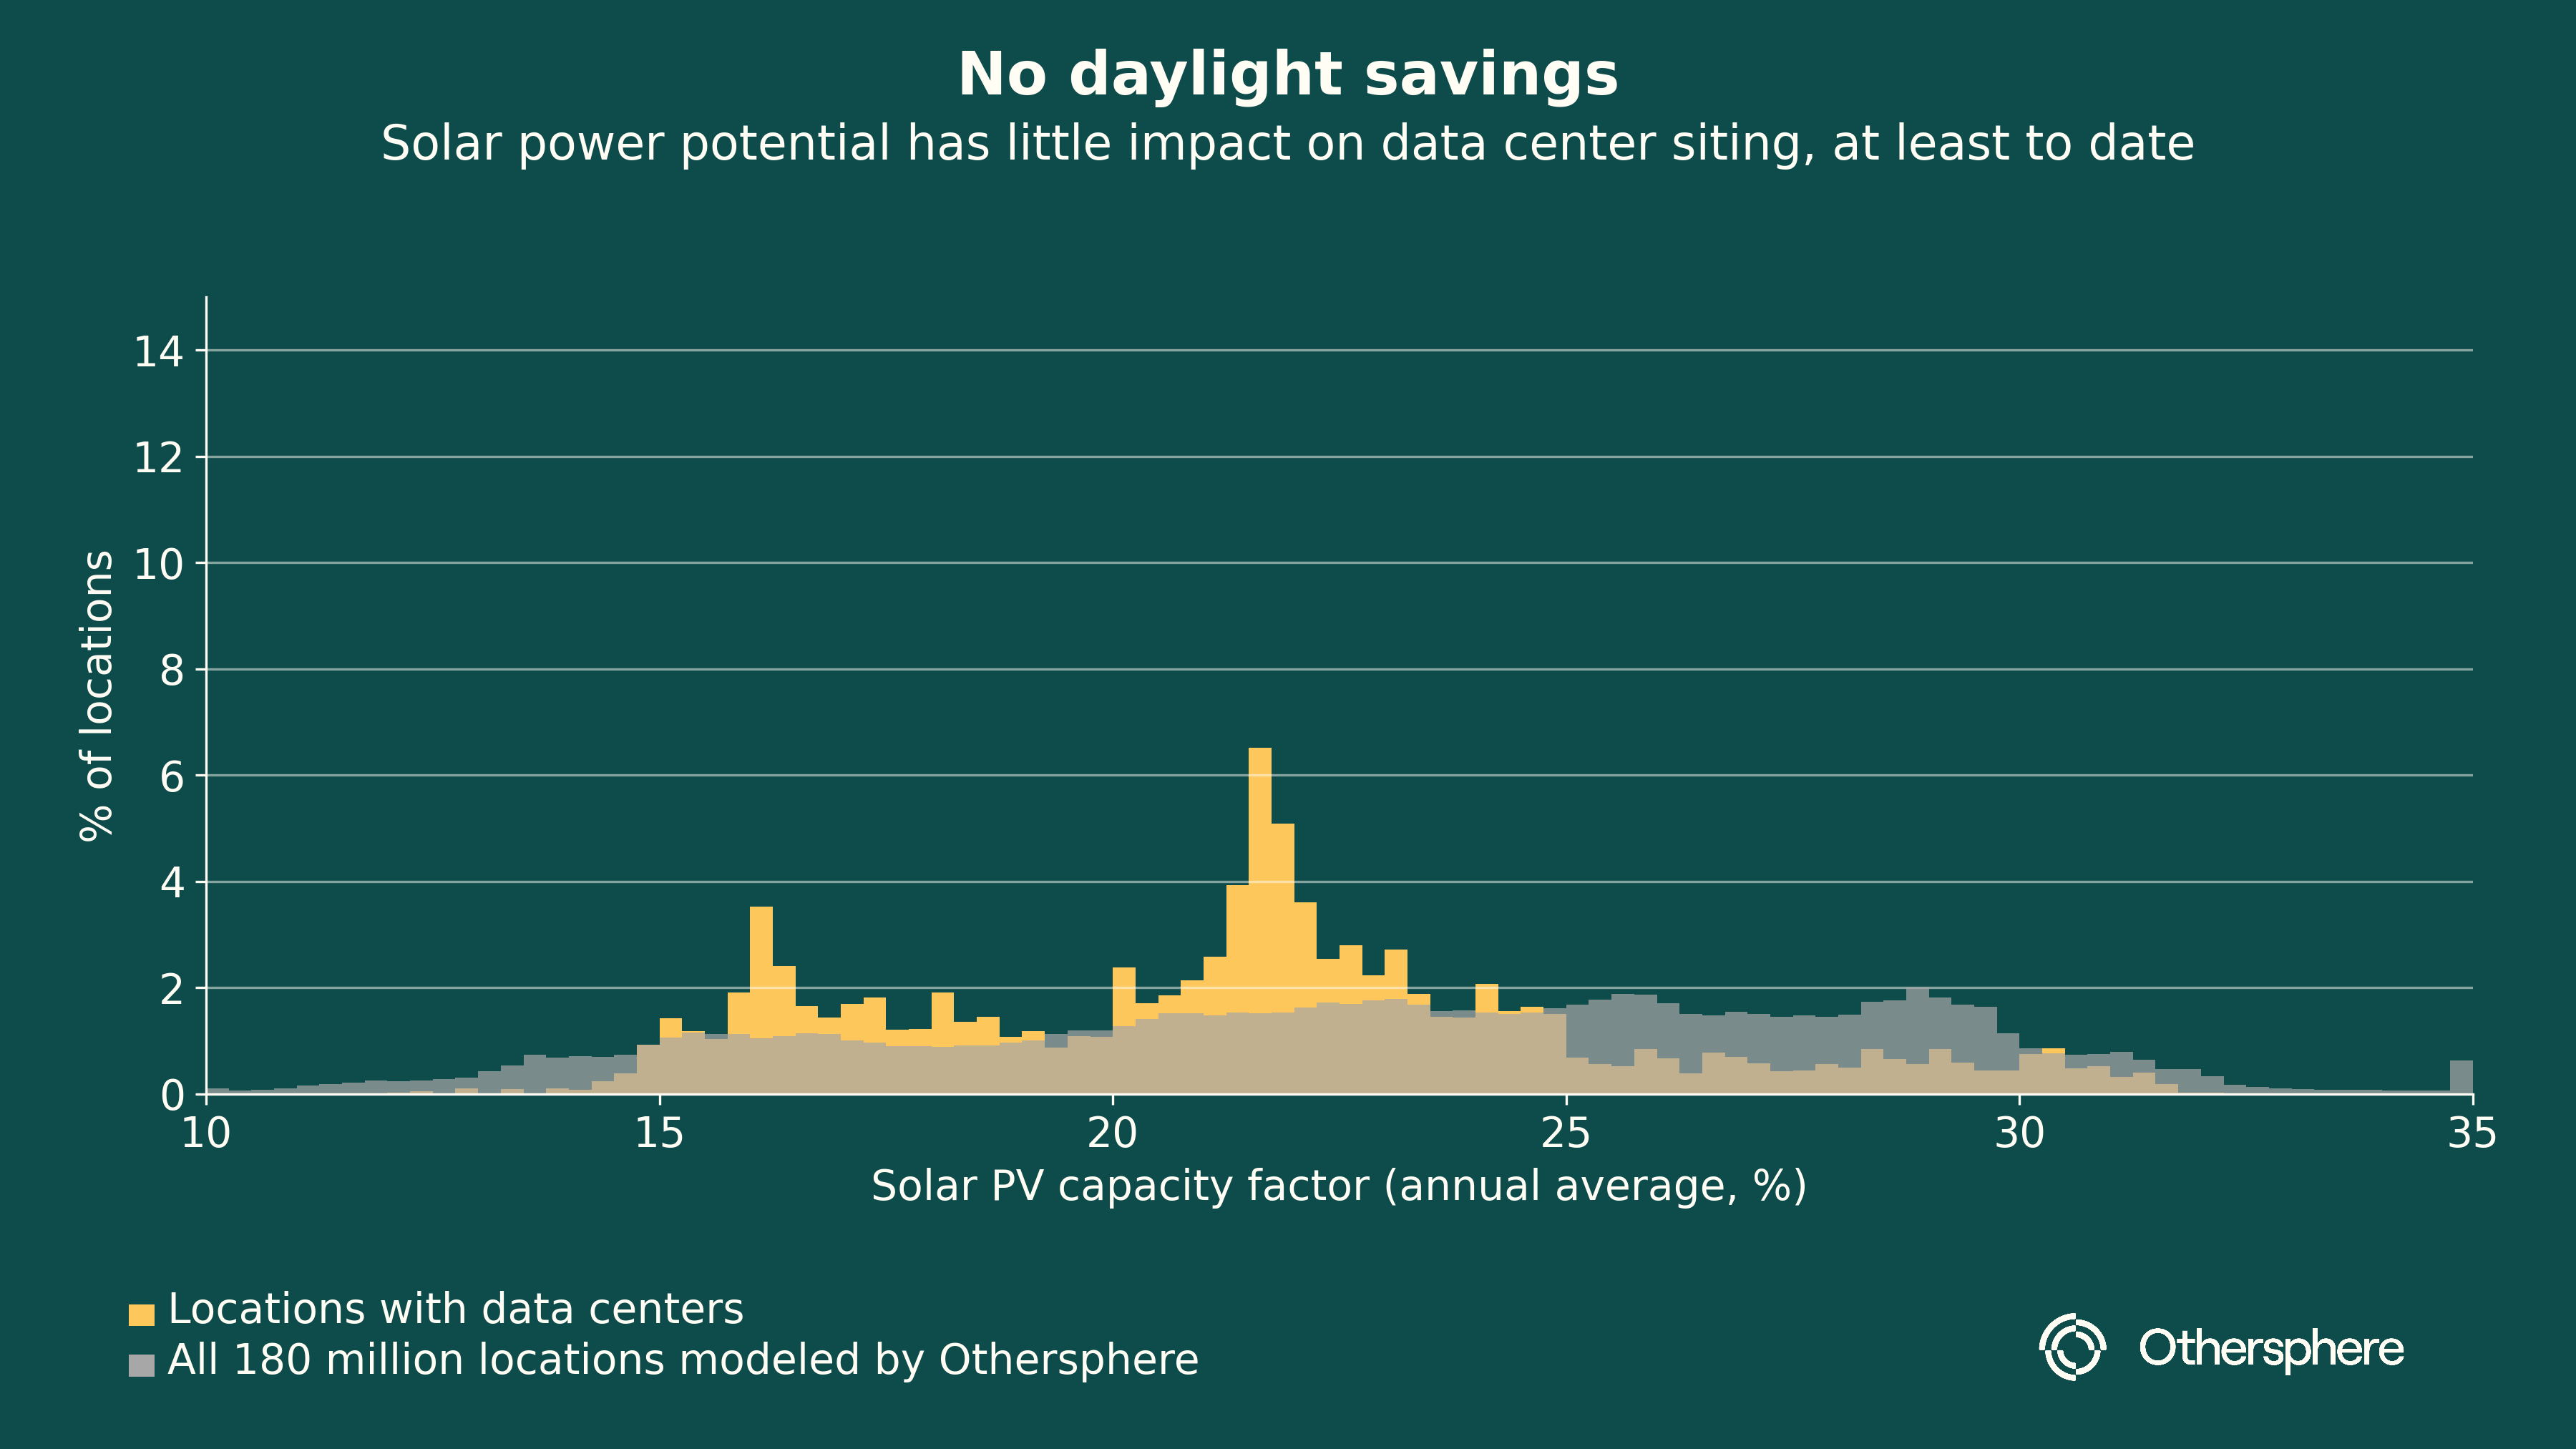
Annual solar PV capacity factor data above shows, today’s data centers show little sun-seeking behavior. Hourly capacity factor data shows a similar pattern.
Please reach out if you would like to learn more about Othersphere, our products, and opportunities to partner in accelerating global industrial decarbonization.


