

Equipment sizing and operating strategy LCOH optimizations for hydrogen electrolysis plants are cumbersome and time-consuming. It can take days to weeks to get the data, with each optimization run often taking hours. This limits analytical efforts to a handful of potential sites, leaving many opportunities unexplored.
The result — sub-optimal capital allocation and higher risks, with countless missed opportunities.The difference between initial cost calculations versus hourly optimizations can be dramatic, and highlights location as a critical element of project success.
Othersphere has revolutionized this process by combining the power of our underlying spatial economics platform with neural networks for dimensionality reduction and surrogate modeling.
Our global search engine now recommends pre-optimized projects in seconds, having already run an hourly optimization considering:
All of this is delivered through the Othersphere Explorer tool, which provides a novel, bottom-up view of potential hydrogen projects, evaluating key factors such as production costs, emissions, available offtakers, and fit with local surroundings.
Source:
Original data source:
Spatial coverage:
Visibility:
Methodology:
Download:
License:
The data provided herein is made available on an "as-is" basis, without warranty of any kind, either expressed or implied. The provider does not guarantee the accuracy, completeness, or usefulness of the information. By downloading this data, the user acknowledges that the provider shall not be held liable for any errors, inaccuracies, or omissions in the data, nor for any damages, losses, or consequences arising from the use, misuse, or reliance on this data. The user assumes full responsibility for the use of the information provided and agrees to use it with caution and at their own risk.
Data center locations today show a moderate skew toward grid regions with lower carbon intensity—but how much does this really influence site selection?
At CERAWeek 2025, data centers were very heavily discussed, including topics such as geopolitics, data sovereignty, monetization opportunities for previously-stranded energy supplies, and the overall uncertainty data centers have introduced into energy demand forecasting.
Climate change factored into conversations on the role of natural gas, nuclear, and geothermal, but global warming was generally just one of the many complexities described by the developers, funders, and policymakers working on the future of compute.

Data center locations today show a moderate skew toward grid regions with lower carbon intensity—but how much does this really influence site selection?

Speed to market, economics, data sovereignty, and end-user latency are some of the most critical factors for developers, operators, and financiers of compute / AI infrastructure.
Focus on carbon intensity of compute will continue to grow however, particularly as policymakers and the public become ever more aware of the rising energy demand and climate impact of data centers.
But as the annual solar PV capacity factor data above shows, today’s data centers show little sun-seeking behavior. Hourly capacity factor data shows a similar pattern.
This makes sense given the challenges created by solar intermittency and limited incentive to experiment with new operating strategies to date.
But in the right locations, this will likely shift going forward due to:
⬡ Falling delivered costs of solar power
⬡ Increasing market and behind-the-meter supply options
⬡ Corporate GHG goals and public attention shaping demand
⬡ Proving out reliable data center operating strategies that take advantage of intermittent power and/or load shifting.
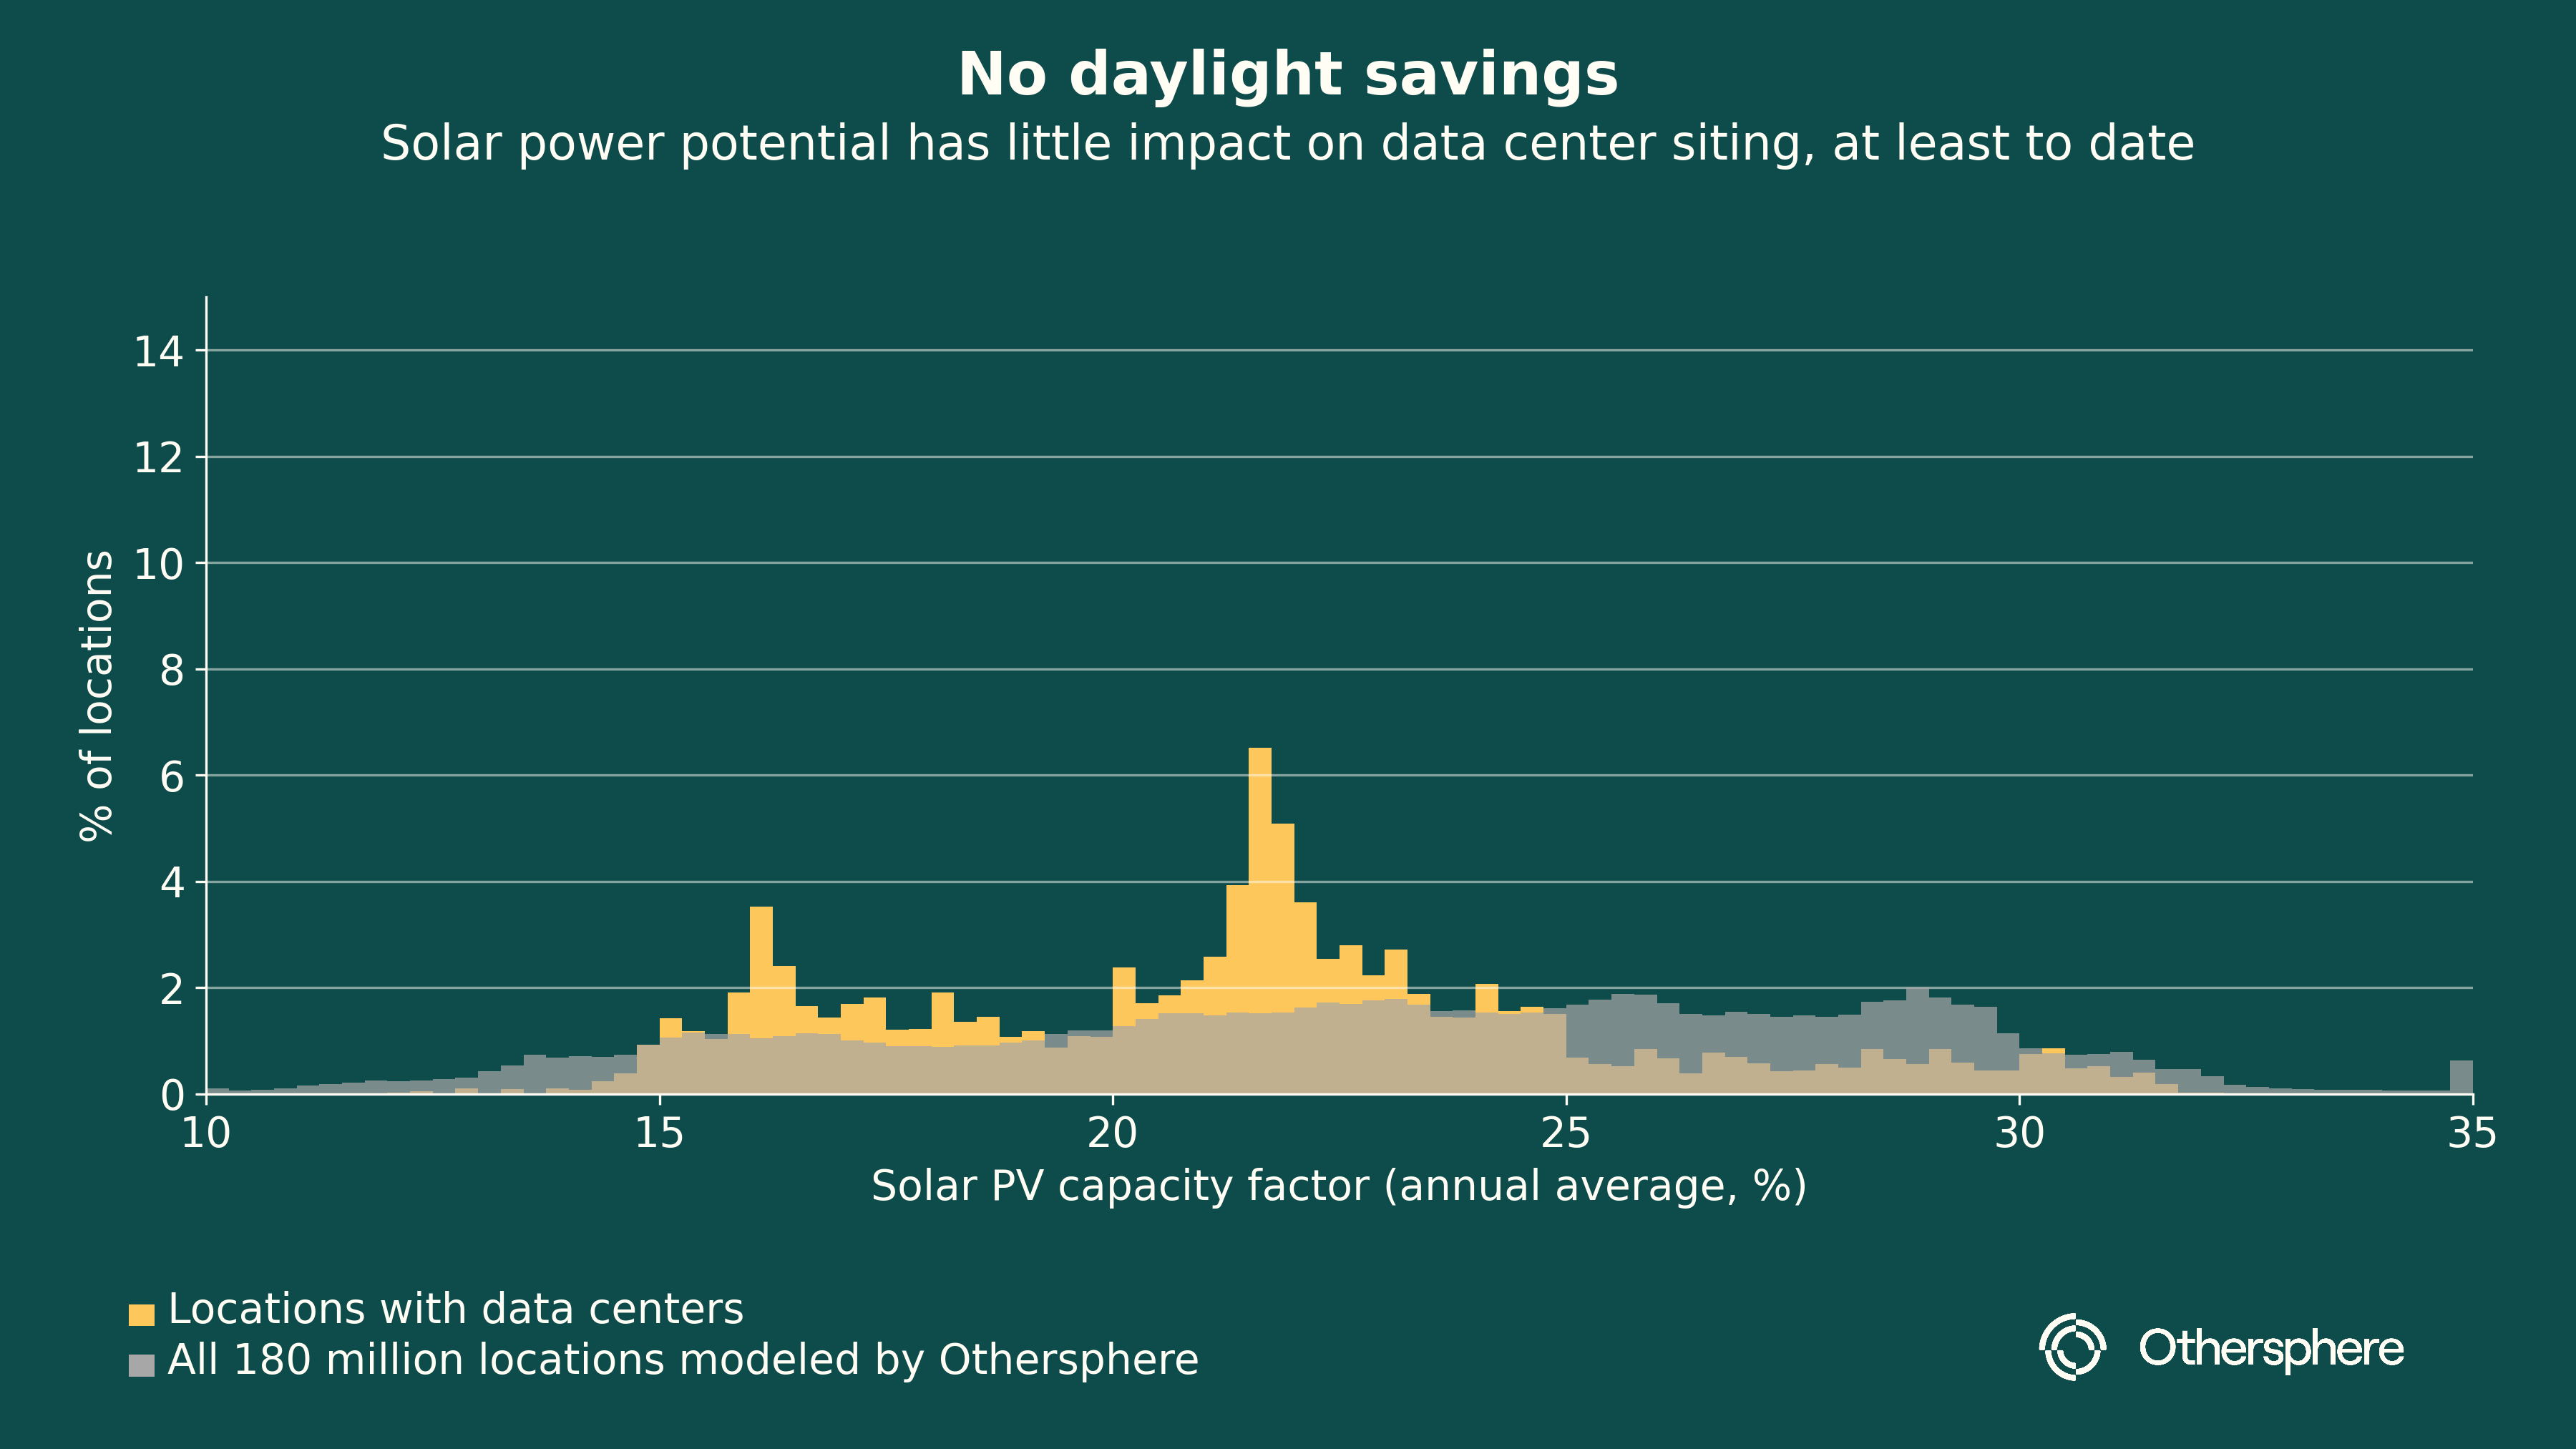
Annual solar PV capacity factor data above shows, today’s data centers show little sun-seeking behavior. Hourly capacity factor data shows a similar pattern.
Please reach out if you would like to learn more about Othersphere, our products, and opportunities to partner in accelerating global industrial decarbonization.


